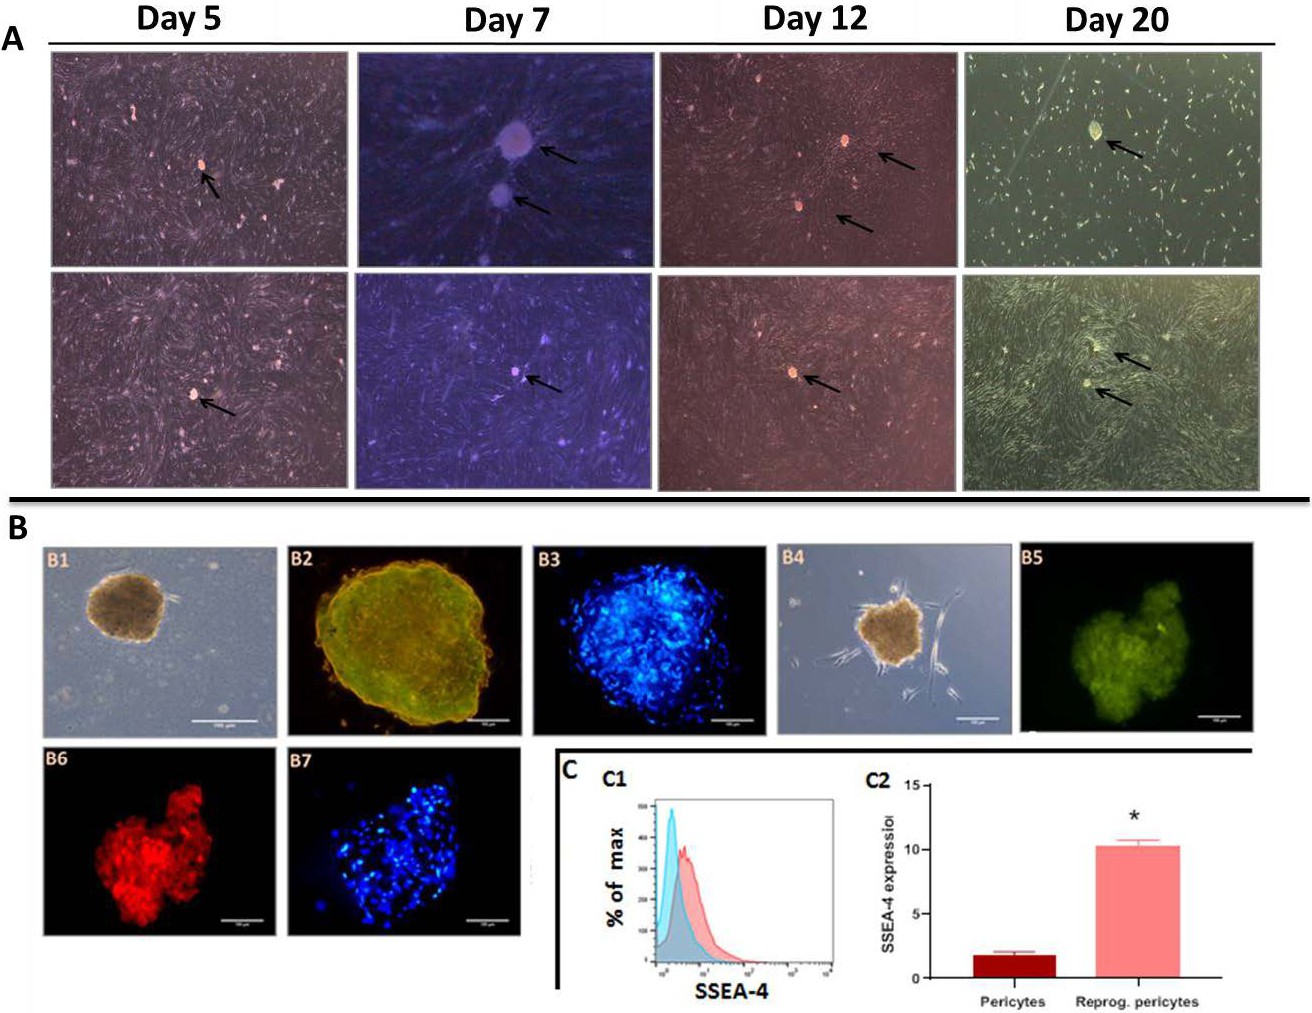
Fig. 7. Characterization of iPSC-like colonies. A. Stereo-microscope images of reprogrammed pericytes showing regular-shaped colonies with sharp boarders (days 5-20). B. Inverted florescence microscope images of pericyte-derived iPSC-like colonies attached to a cover slip after they were picked on day 5. B1. BF (bright field) image of an attached colony. B2. fluorescence image of the same colony showing the expression of b-catenin. B3. nuclear staining with Hoechst 33342. B4. An image of another attached colony. B5 and B6. florescence images of the same colony showing positive expression of the pluripotency markers Oct-4 and Nanog . B7. nuclear staining with Hoechst 33342. C. Flow cytometry analysis of iPSC colonies. C1, C2. Showing the expression of SSEA-4, a highly specific embryonic stem cell marker, before and after reprogramming into iPSCs.